ANALYZE User Guide
Overview
The ANALYZE tool allows you to look at the traffic and advertising usage data of your linear channel. The ANALYZE tool is consist of three main dashboards:
Content
Advertising
Delivery

The default dashboard being load in ANALYZE tool is Content.
Dashboards
Content
This dashboard allows you to look at the performance of your linear channel and programs. It contains the following two tabs and tables:
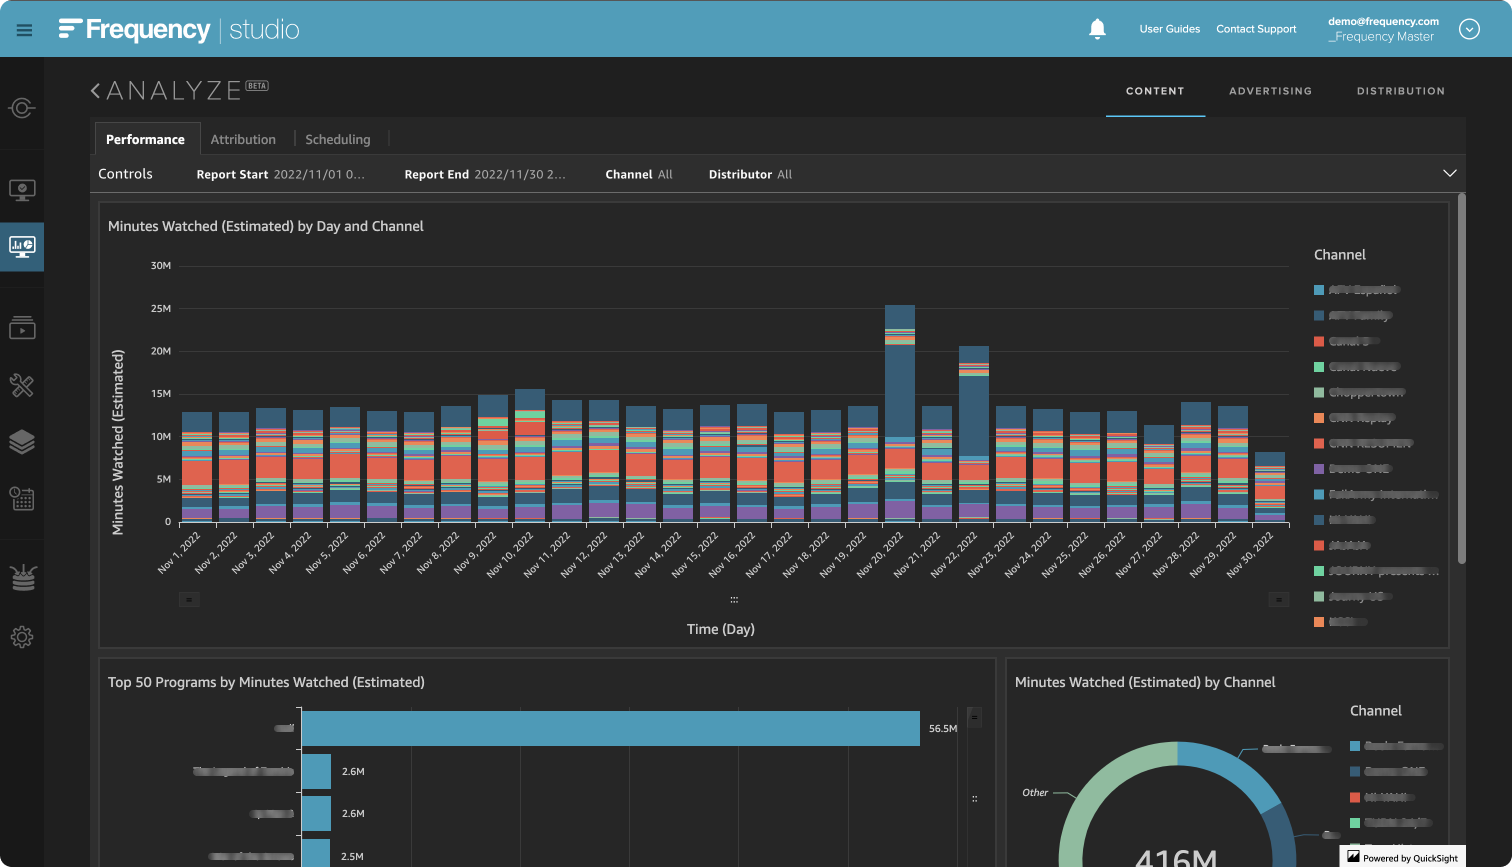
Performance
Minutes Watched by Day and Channel
Top 50 Programs by Minutes Watched
Minutes Watched by Channel
Minutes Watched by Distributor
Attribution
Linear Program Performance Attribution
Asset Performance Attribution
Interstitial Performance Attribution
Linear Program Schedule Share
Scheduling
Average Minutes Watched (Estimated) by Day of Week and Channel
Average Minutes Watched (Estimated) by Hour Of Day (UTC) and Channel
Linear Program Scheduling by Channel
Users
Unique Users by Day and Channel
Top 50 Programs by Users
Unique Users by Channel
Users by Distributor
Average Users by Day of Week and Channel
Average Users by Hour Of Day (UTC) and Channel
*Controls (filter report by): Report time period, Channel, Distributor
Attribution
Top Programming by Month (includes duration of program, minutes watched, Ads filled, and Ads opportunities)
*Controls (filter report by): Report time period, Program title, Channel, Distributor
Value Title | Definition |
|---|---|
Channel | Linear channel title. |
Program Name/Linear Program | Program title as it is displayed in the schedule. |
Duration (Minutes) | Total duration of the scheduled program. |
Count/Occurence | How many times this program has aired in the selected timeframe. |
Minutes Watched (Estimated) | The minutes of streams delivered to end users when Frequency is providing end user CDN for HLS streams. In cases where the distributor is handling CDN, Frequency will not have accurate data. It is also possible a user exits a channel before consuming every second of the data delivered, causing in a small over-estimation of consumption. |
Watched Ratio | The number of active streams for any given minute of scheduled time for the program for the period selected. A metric that helps normalize watch minutes for total minutes a program aired in the range. The formula for this is: Minutes watched / (Duration * Count) |
Ads Filled (Minutes) | Ad minutes successfully filled, when Frequency is handling SSAI. |
Ads Opportunited (Minutes) | Ad minutes in programs that failed to fill with advertising, when Frequency is handling SSAI. |
Ads Render Rate (%) | Ratio of ad minutes successfully filled when Frequency is handling SSAI. |
Video Title | Title of the actual video asset playing (this can differ from the actual program name, and is asset specific). |
Video Description | Description of the video playing out. |
Brand | Brand that the video is displayed in, viewable in Manage. This is separate from the linear channel title. |
External ID | The ID ingested from the partner, if included in delivery. Can be used to cross reference content provider metrics. |
Frequency ID | Frequency's internal video id for the record. |
Percentage of Timeframe | The total percentage of time a specific program has used within the filtered time range for the report. |
Advertising
This dashboard allows you to look at the advertising usage data of your linear channel. It contains the following four tabs and tables:
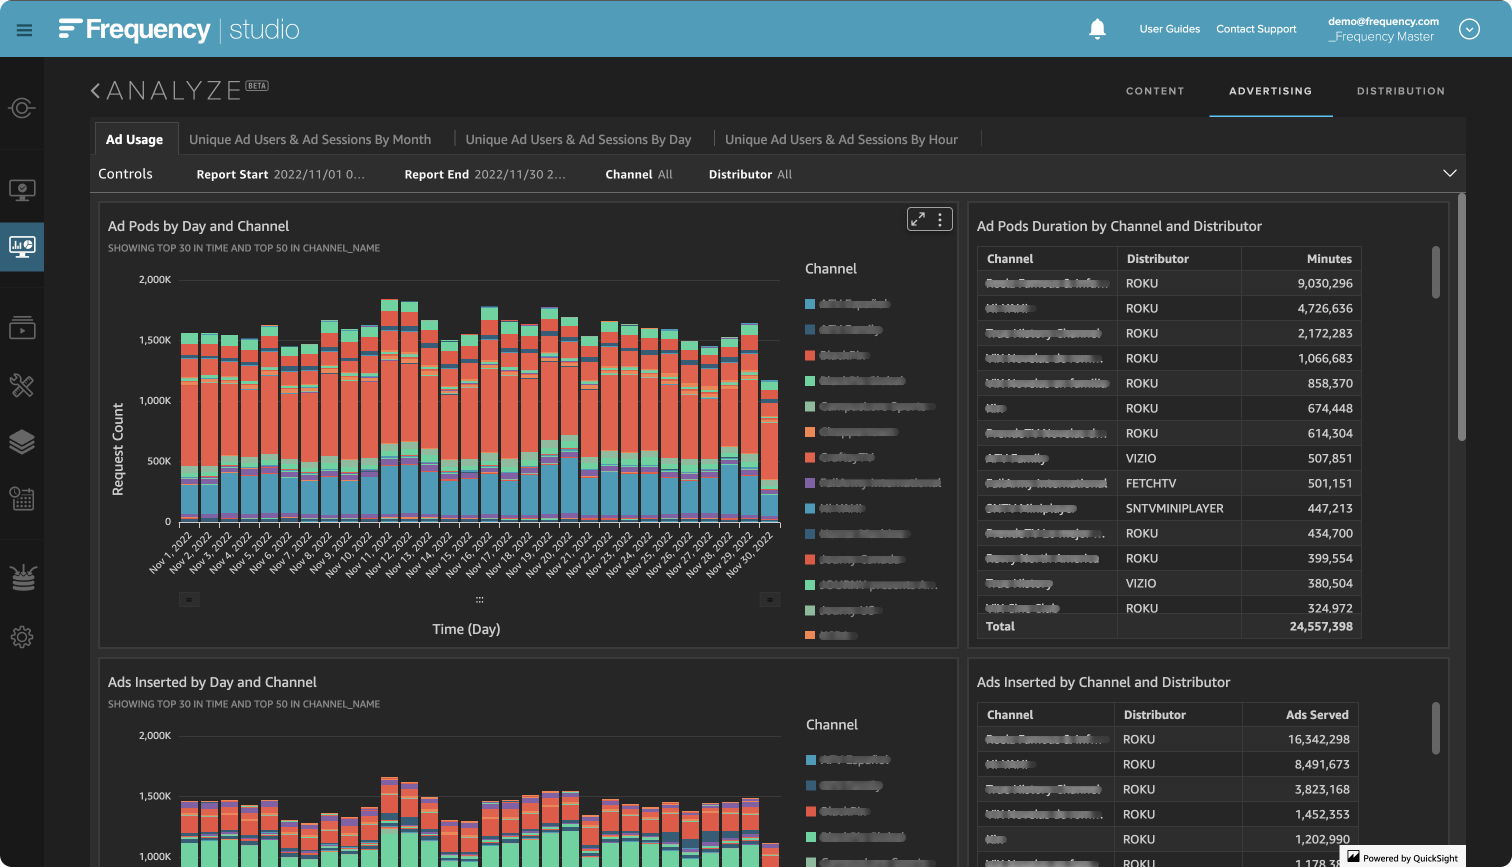
Ad Usage
Ad Requests by Day and Channel
Advertising Opportunities by Channel (in Seconds)
Ad Pods by Day and Channel
Ad Fill Rate by Channel
Ads Served by Day and Channel
Total Ads Served by Channel
Ad Error by Type
Error Rate by Channel
*Controls (filter report by): Report time period, Channel, Distributor
Unique Ad Users & Ad Sessions by Month
Unique Ad Users by Month
Unique Ad Sessions by Month
*Controls (filter report by): Report time period, Channel, Distributor
Note: Drilling down to day or minute level will result in inaccurate result.
Unique Ad Users & Ad Sessions by Day
Unique Ad Users by Day
Unique Ad Sessions by Day
*Controls (filter report by): Report time period, Channel, Distributor
Note: Drilling up to month or down to hour level will result in inaccurate result.
Unique Ad Users & Ad Sessions by Hour
Unique Ad Users by Hour
Unique Ad Sessions by Hour
*Controls (filter report by): Report time period, Channel, Distributor
Note: Drilling up to day or month level will result in inaccurate result.
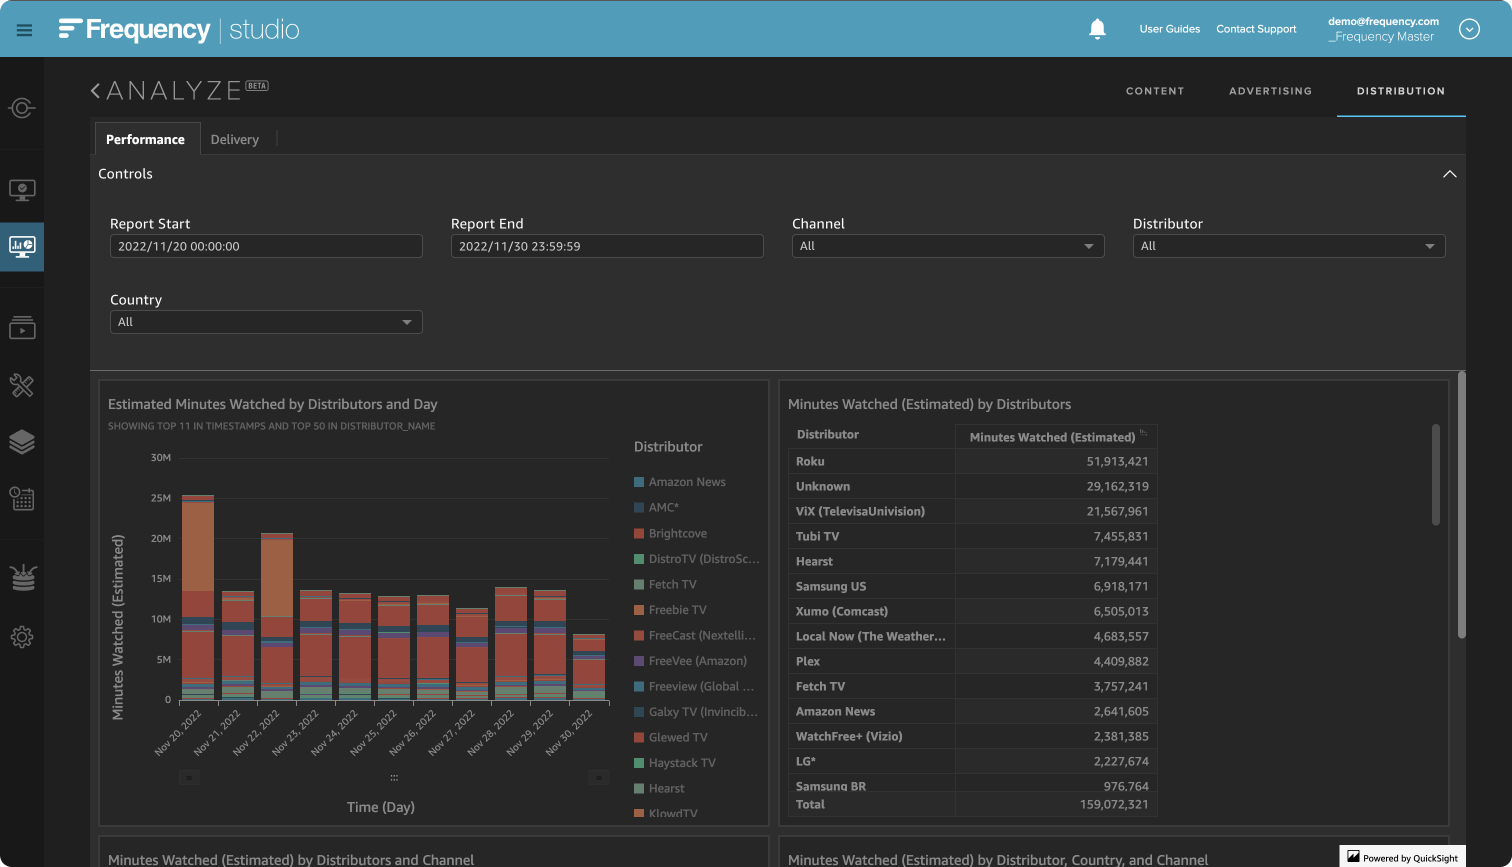
Distribution
This dashboard allows you to look at the traffic data of your linear channel. It contains the following tab and tables:
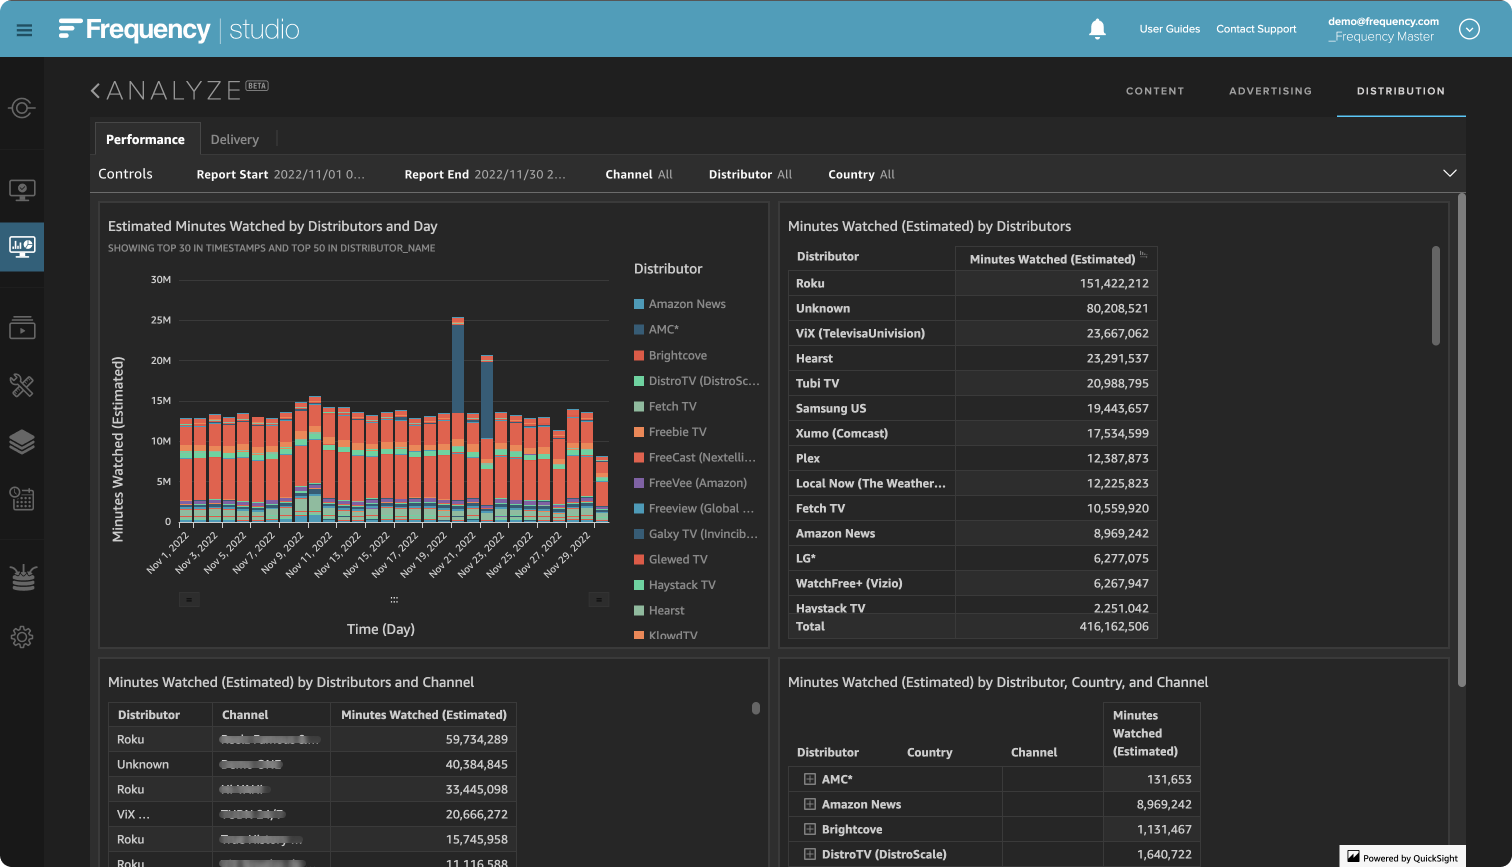
Distribution
Requests by Channel and Day
Requests by Channel and Month
Bandwidth (GB) by Channel and Day
Bandwidth (GB) by Distributors
Channel Starts in USA by City and Channel
Top 10 Channel Starts in USA by City
Channel Starts by Channel and Distributor
Channel Starts by Channel and Day
Average Concurrent Users by Channel and Hour
Percentage of Video Resolution by Day
*Controls (filter report by): Report time period, Channel, Distributor, Country (in ISO 3166-1 alpha-2 code), Continent, Region/State(in ISO 3166-2 subdivisions assigned codes), and City
Basic Usage
Controls
Click on the double down arrows on the right side of the screen to open the ANALYZE control panel
Note: When loading after updating the controls, the dashboard will turn dark. It will turn light again once the data is loaded.
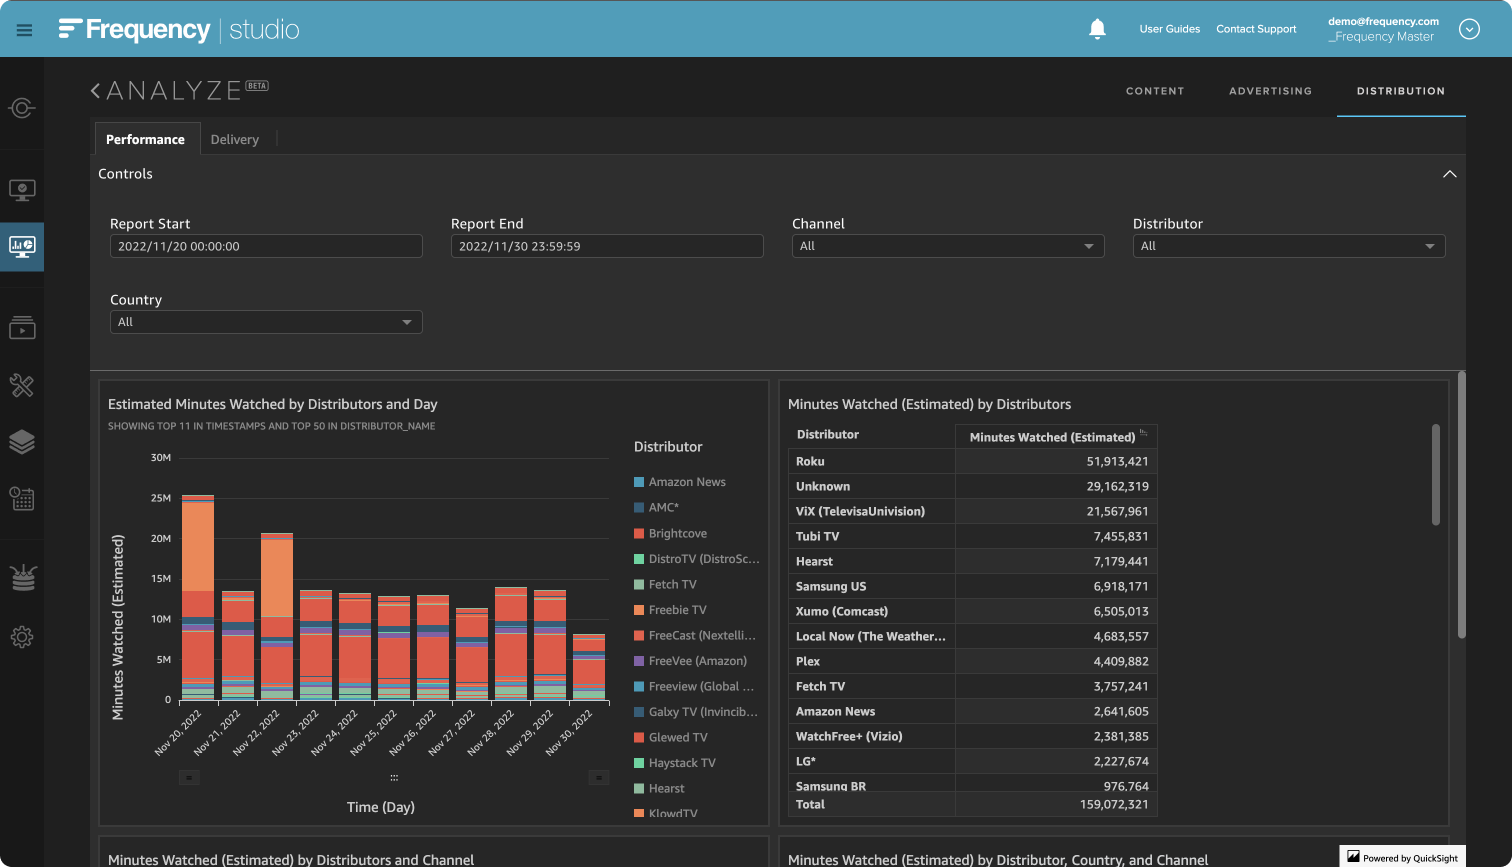
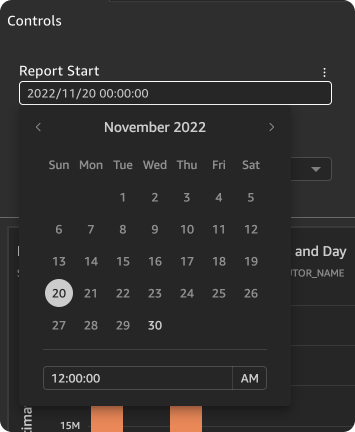
Time Range
Click on Report Start/Report End control.
A calendar will drop down.
Set the report start/end date and time.
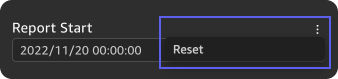
Note: You can reset time range by clicking the "..." on the top right corner of the control
Other Filters
Most of the controls can select multiple
Click on the control you want to filter.
A drop down will appear.
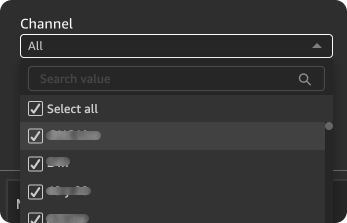
You can select a few by unchecking "[ALL]" and then checking the ones you wish to see.
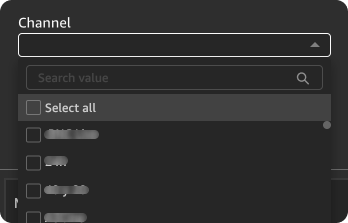
Or You can filter a few by unchecking the ones you wish to filter out.
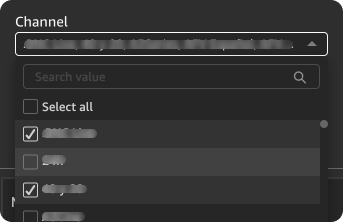
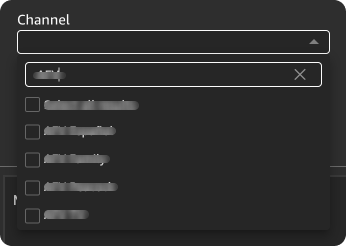
You can also search specific value by typing in the "Search value" field and press enter to show you the list that matches your search value string.
Graphs
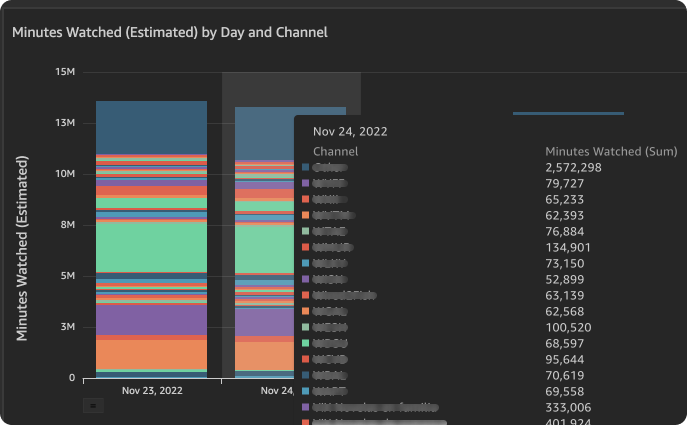
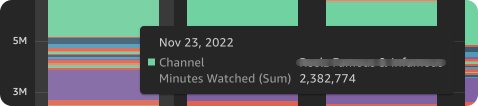
Hovering on top of the graph will show you a tooltip displaying the respective items and their values (You can hover to a specific area of the graph to show only that item and value in the tooltip).
Tables
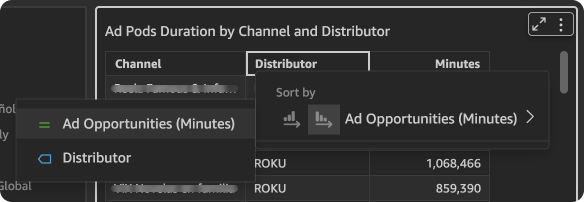
Click on the column header will allow you to sort the table by that column's value
Additional Features
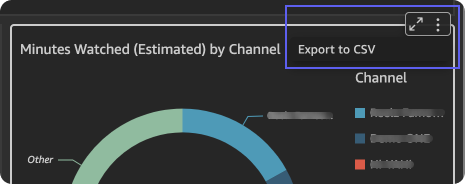
Export to CSV
This allows you to export to CSV for each section of the report.
Click on upper right corner of the report section to activate a down arrow.
Click on the down arrow, and this should open the opportunity to Export report data to CSV
Support
For questions or issues for any Frequency tools, email support@frequency.com