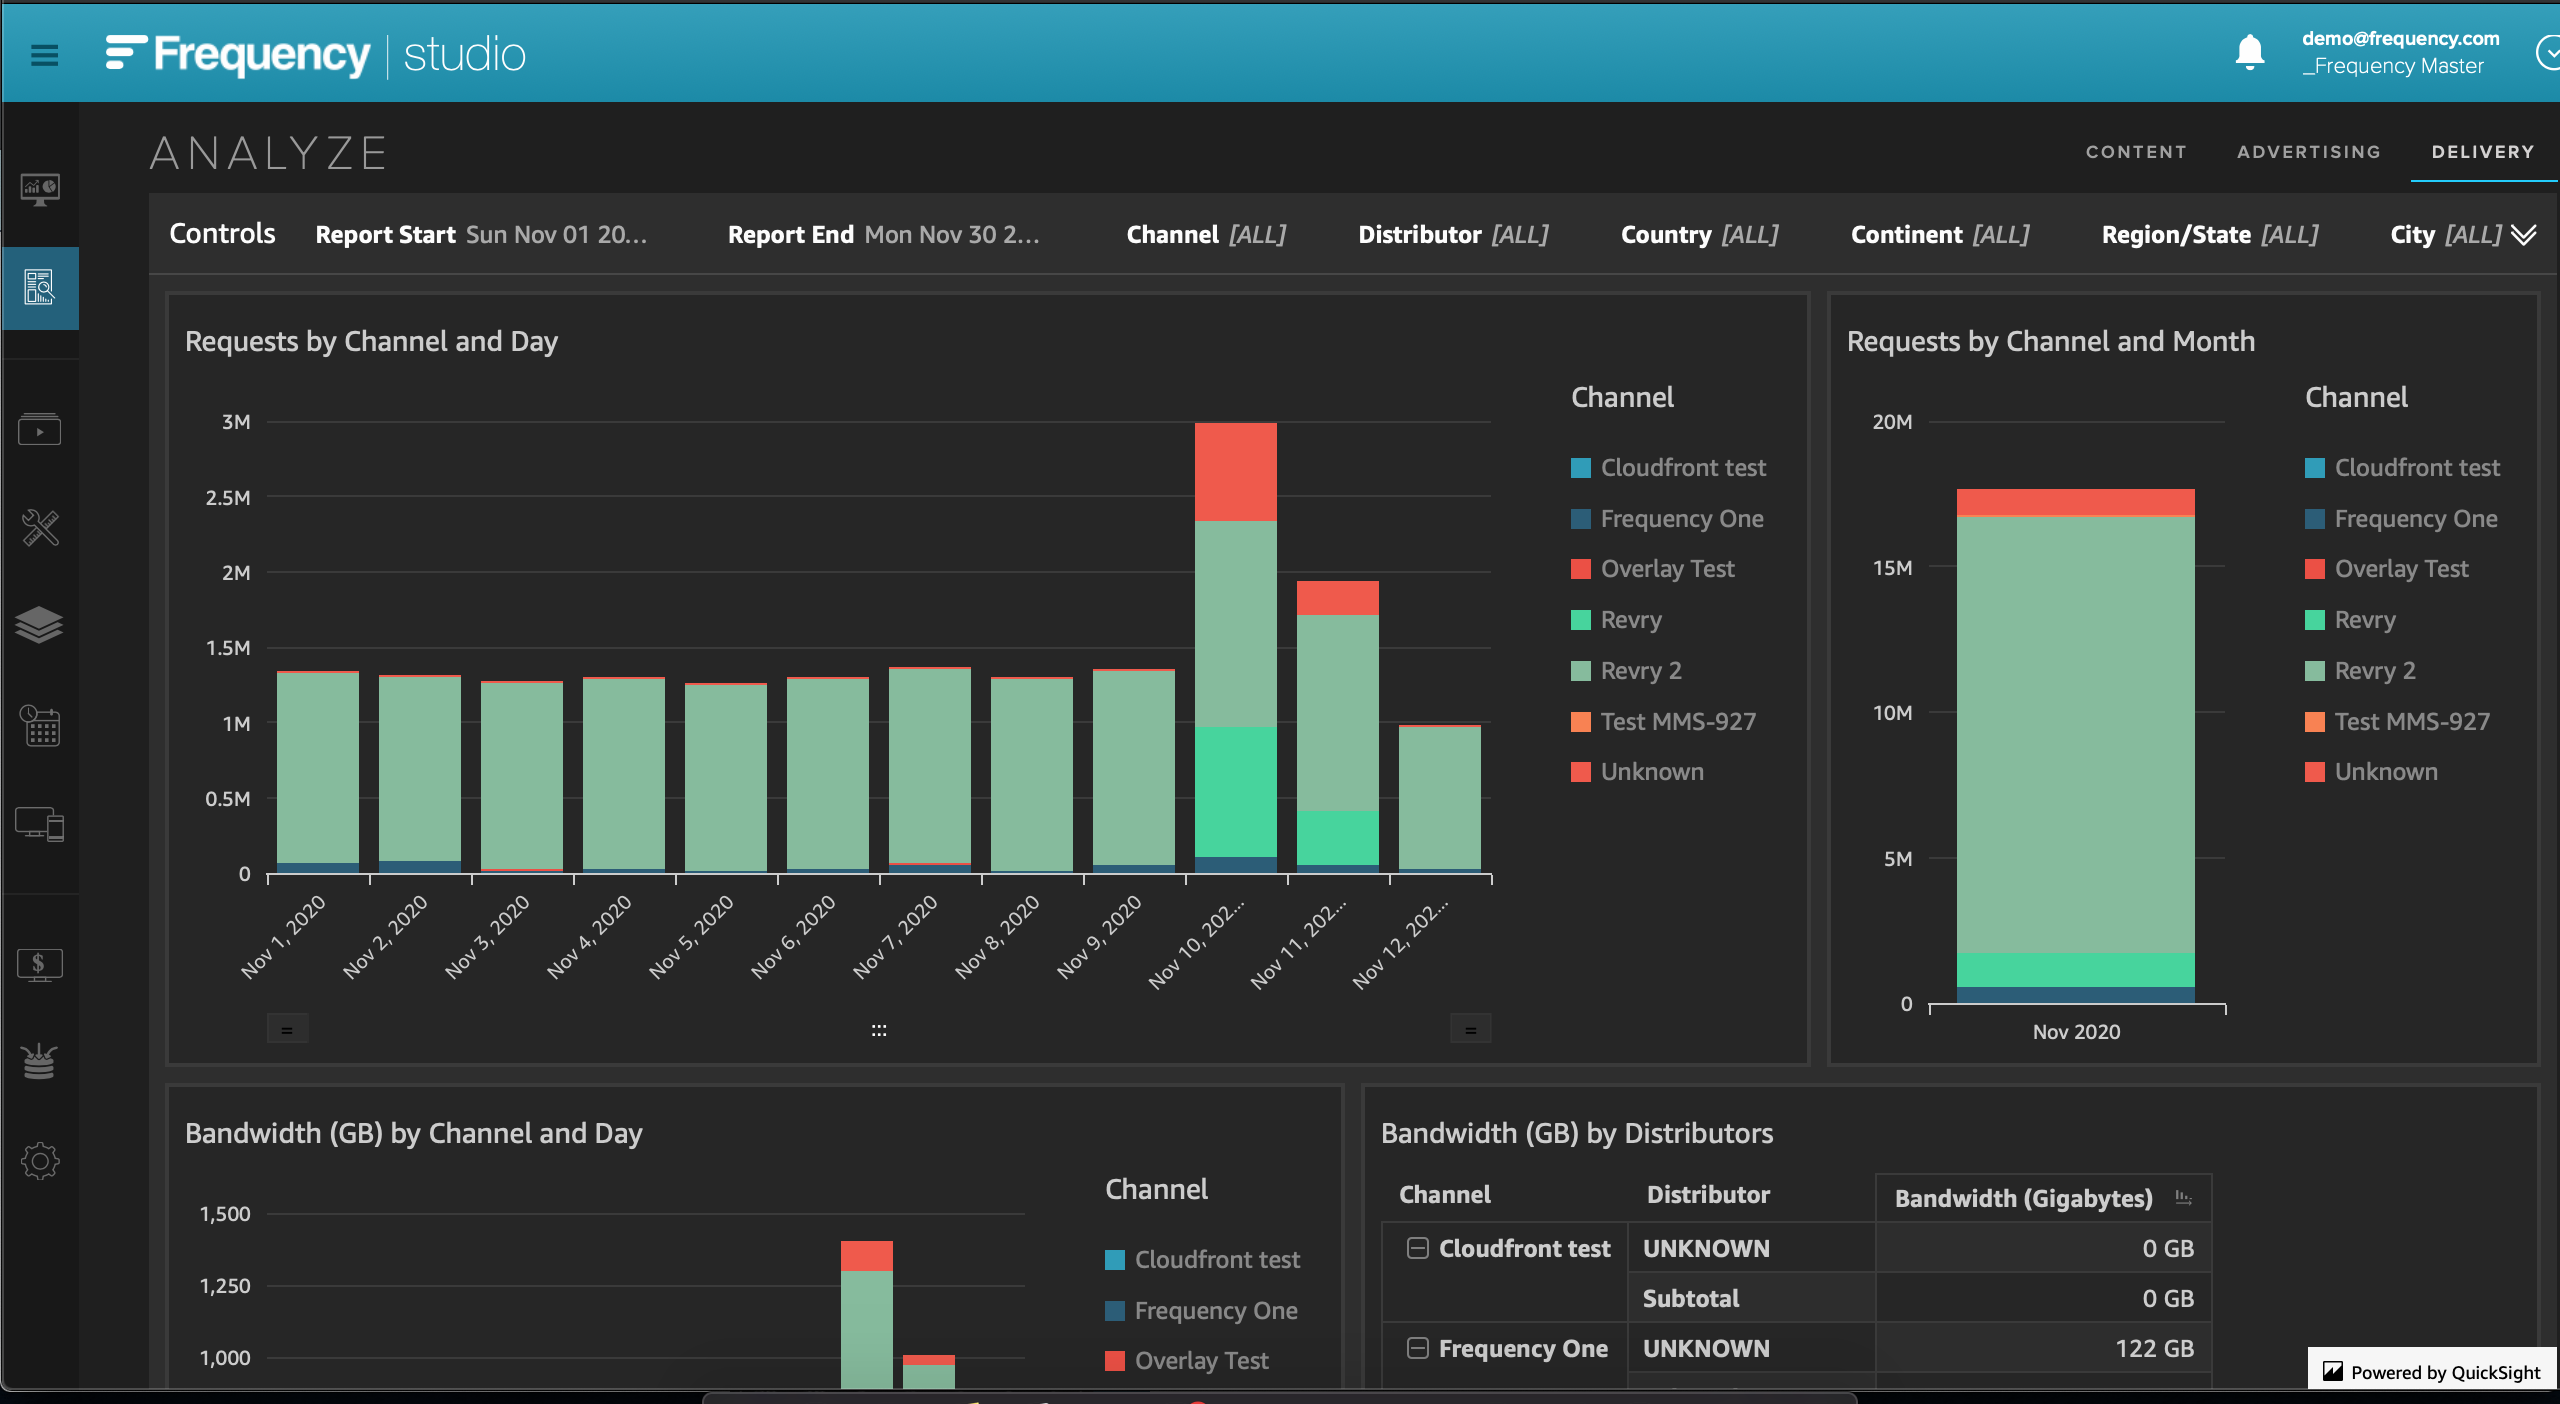
Controls and Filters
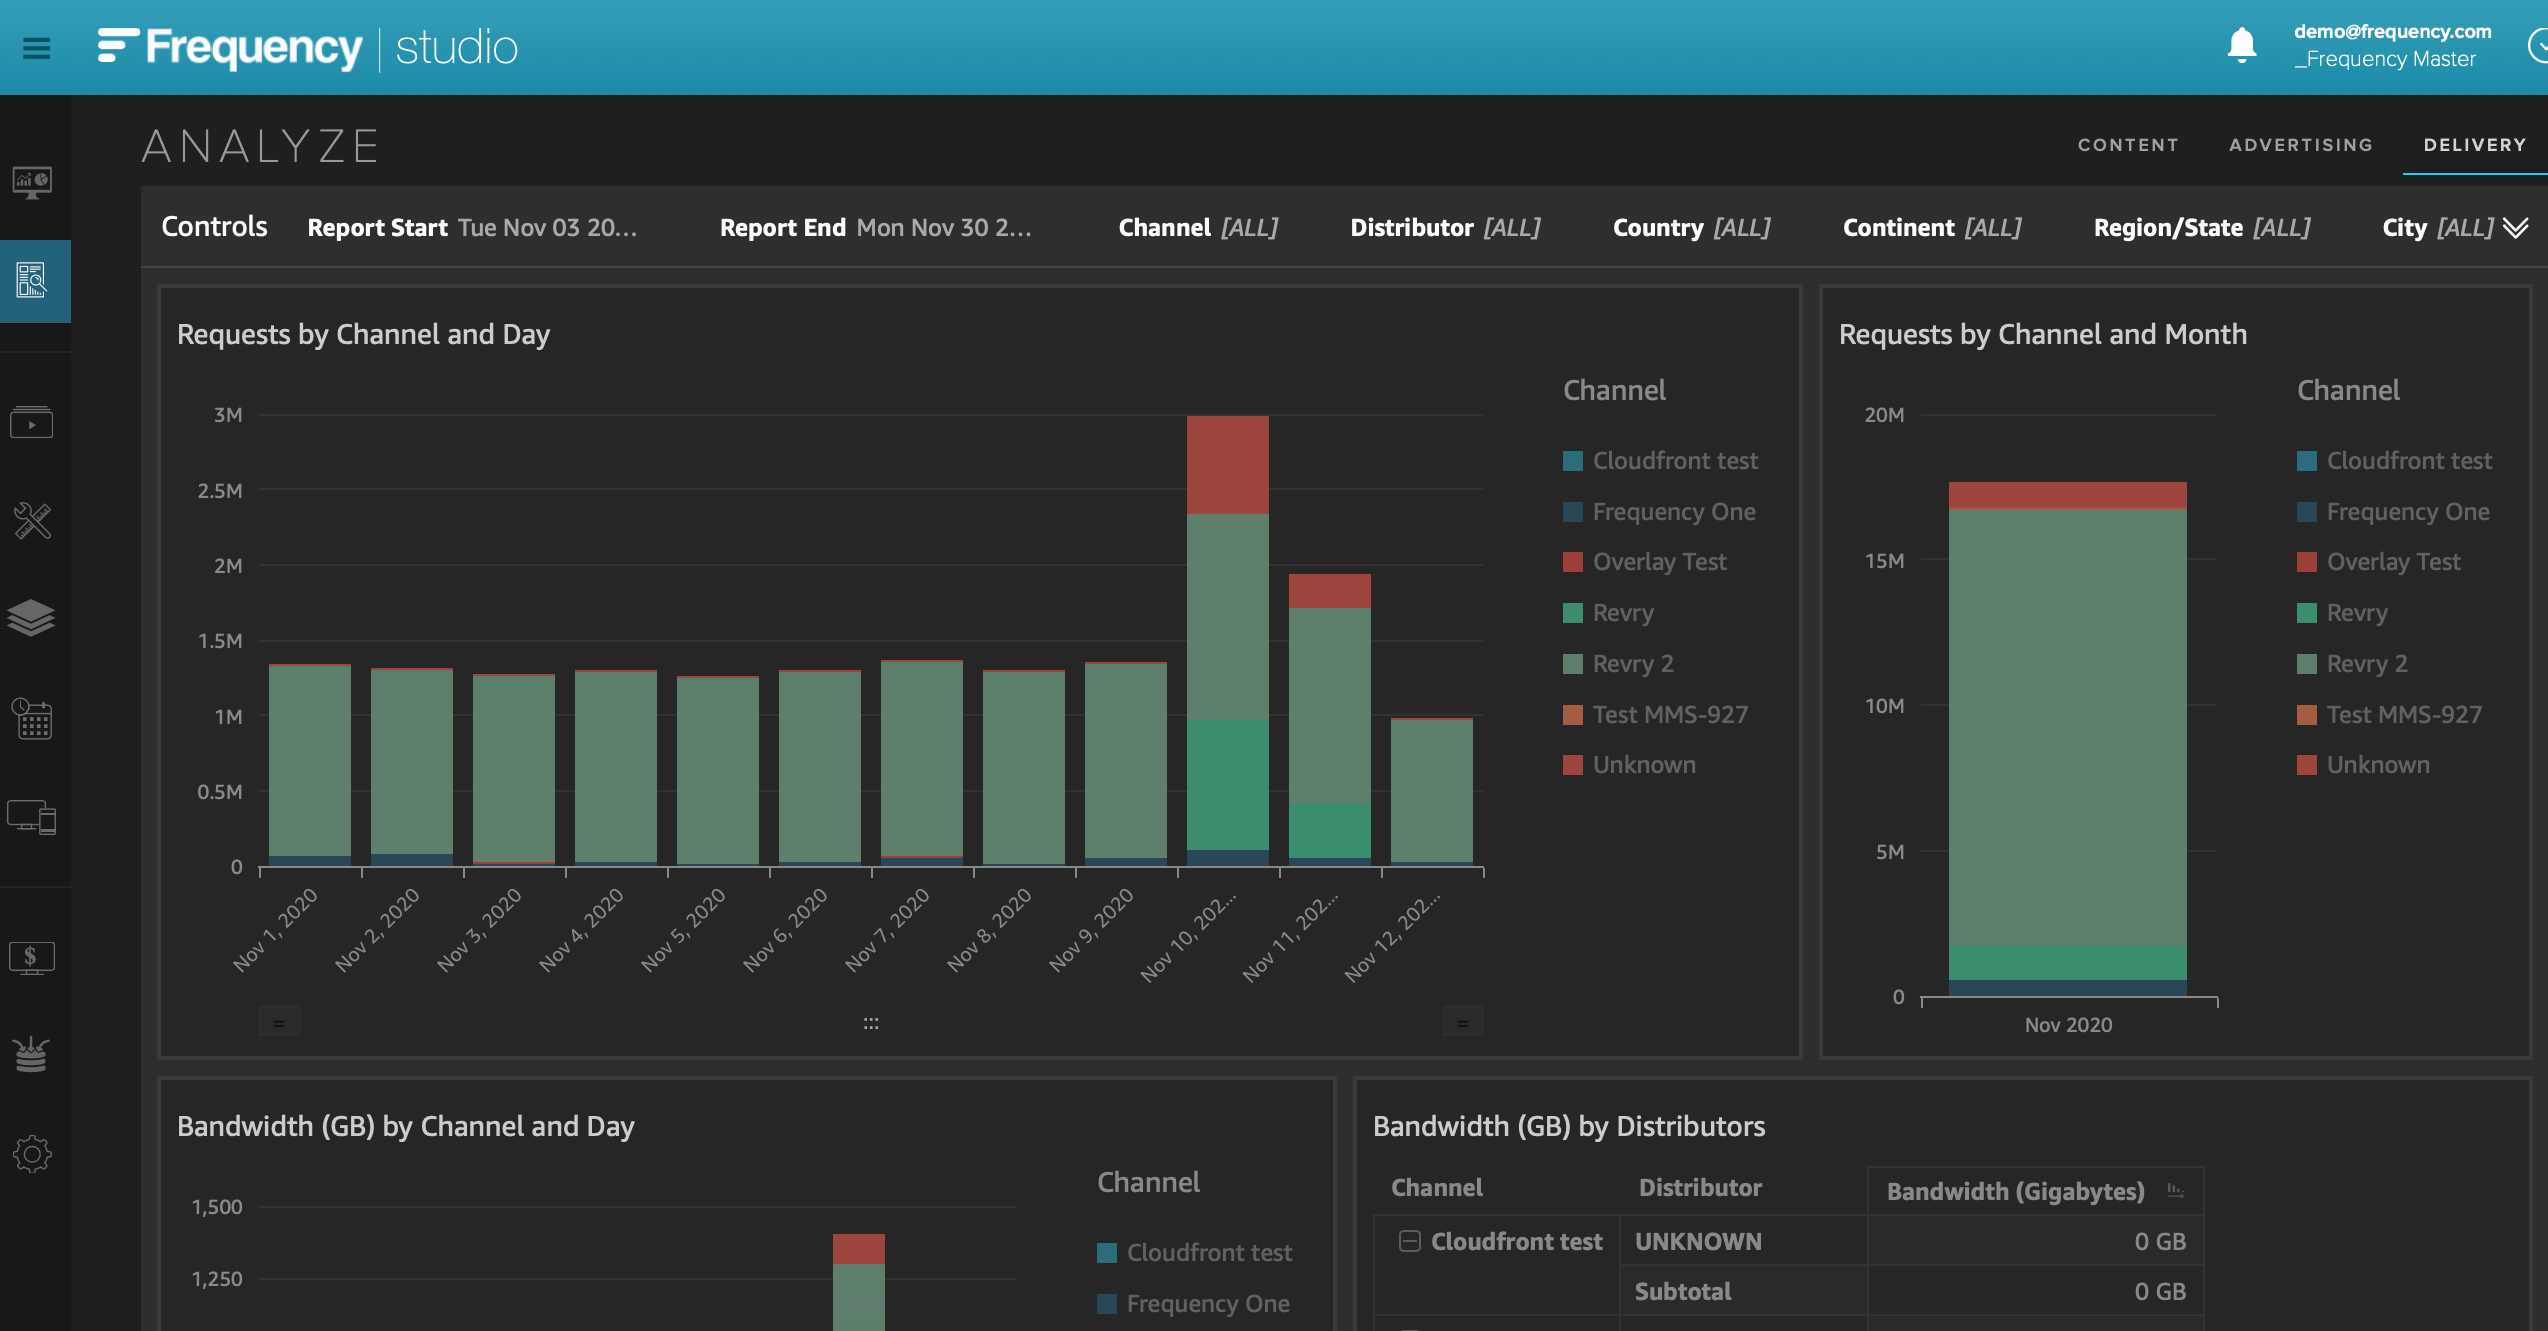
Click on the double down arrows on the right side of the screen to open the ANALYZE control panel
Note: When loading after updating the controls, the dashboard will turn dark. It will turn light again once the data is loaded.
 |
 |
Time Range
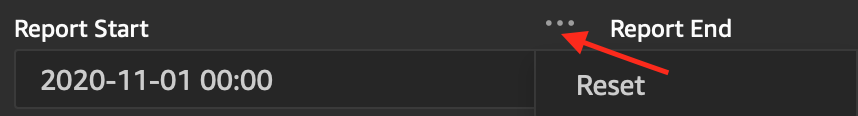
Click on Report Start/Report End control.
A calendar will drop down.
Set the report start/end date and time.
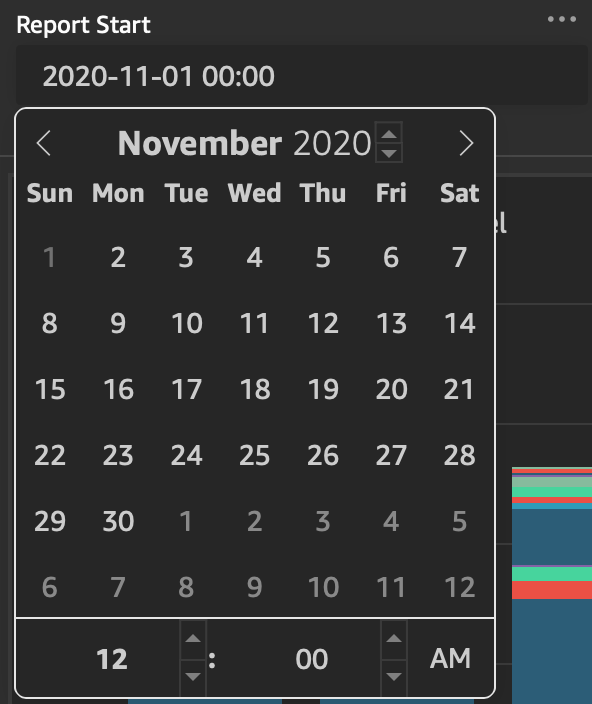 |
Note: You can reset time range by clicking the "..." on the top right corner of the control
 |
Other Filters
Most of the controls can select multiple
Click on the control you want to filter.
A drop down will appear.
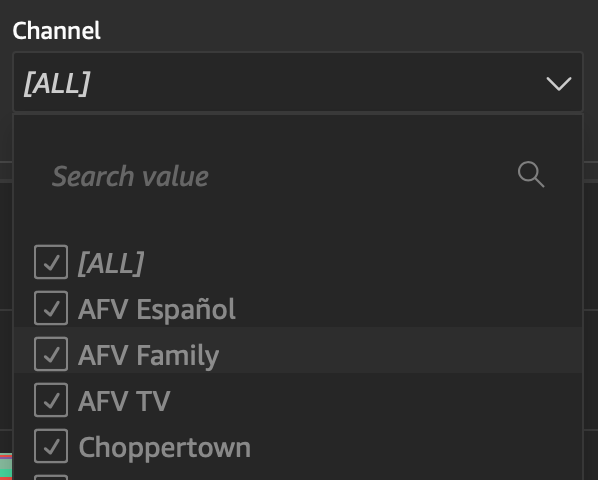
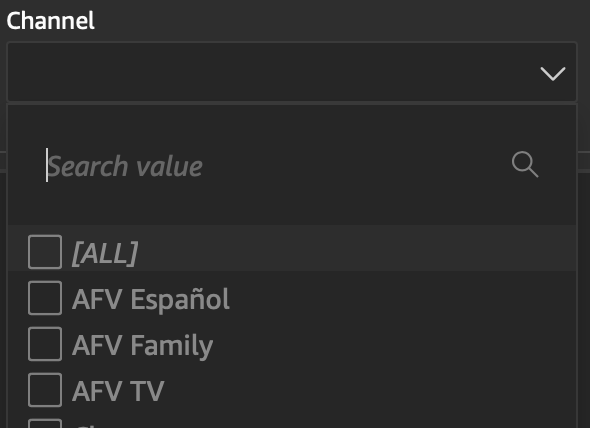
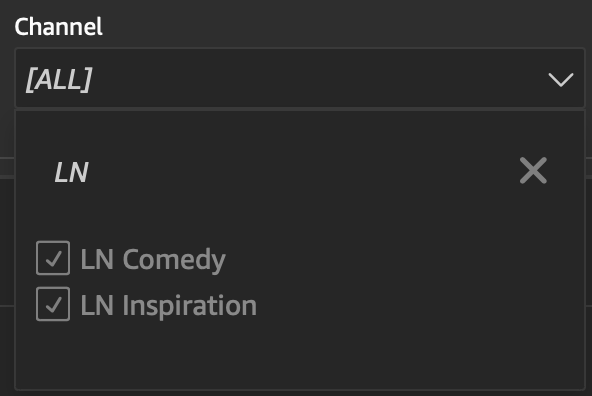
You can select a few by unchecking "[ALL]" and then checking the ones you wish to see.
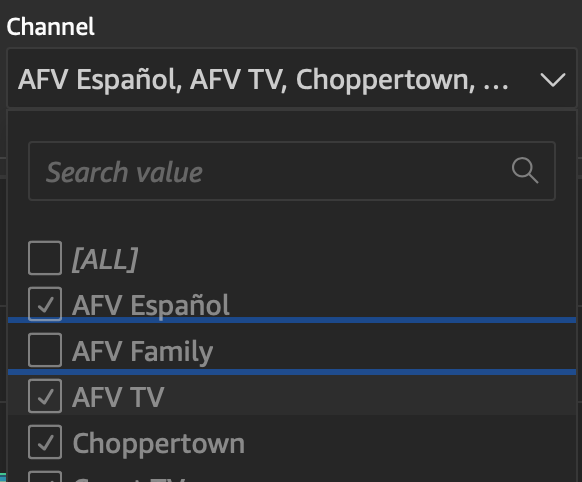
Or You can filter a few by unchecking the ones you wish to filter out.
You can also search specific value by typing in the "Search value" field and press enter to show you the list that matches your search value string.
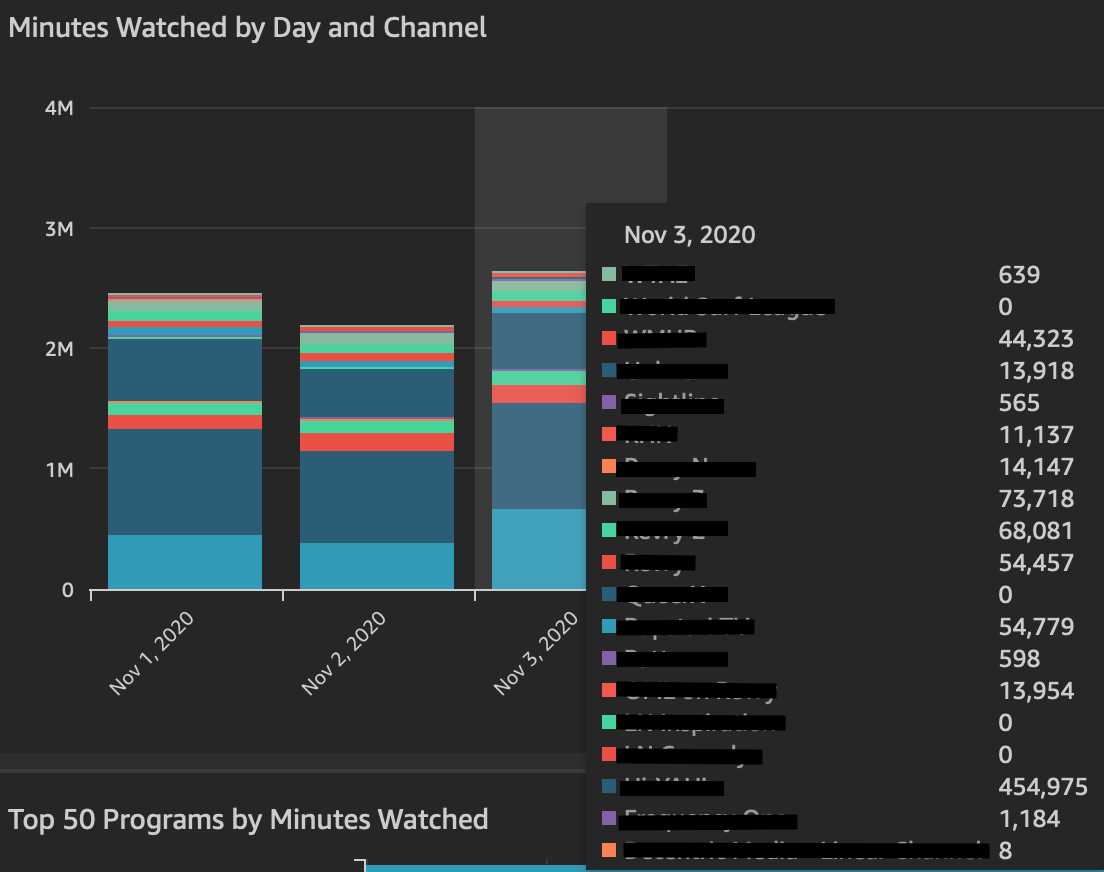
Graphs
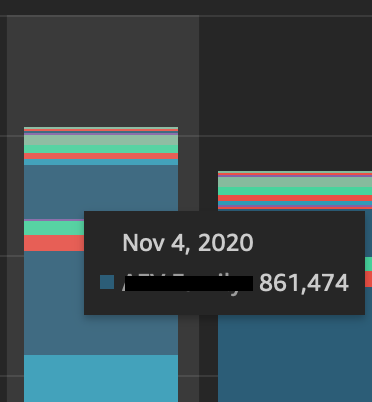
Hovering on top of the graph will show you a tooltip displaying the respective items and their values (You can hover to a specific area of the graph to show only that item and value in the tooltip).
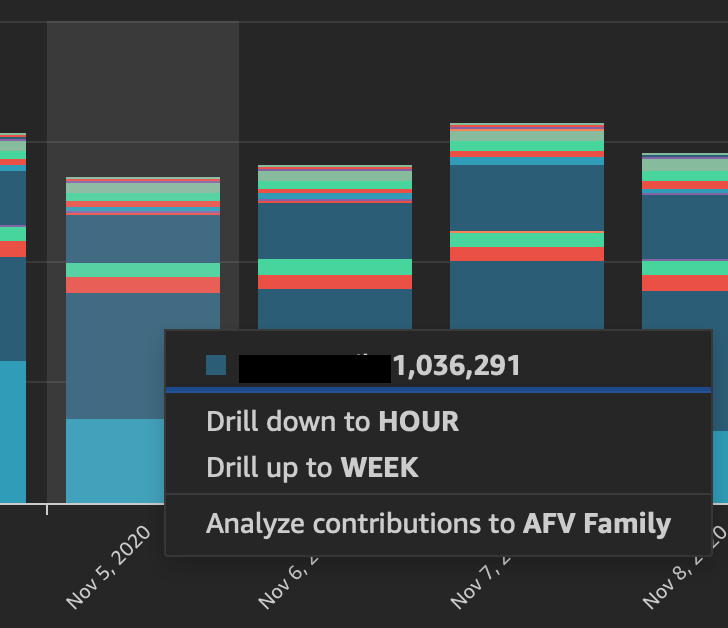
Right click on the graph allows you to drill up or down for that time period.
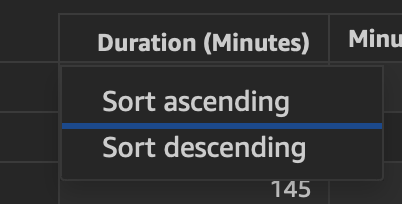
Tables
Click on the column header will allow you to sort the table by that column's value